Let's be honest about Excel.
It served Indian NGOs well for two decades. You could track beneficiaries, log field visits, calculate budgets and generate reports — all in a tool that everyone already had on their laptop. For a 5-person team managing one project, Excel works.
But here's what happens when you scale: the team grows to 20, you're running 4 projects across 3 states and your donor wants quarterly progress reports disaggregated by gender, geography and thematic area. Suddenly, you have 47 spreadsheets, three people maintaining different versions and nobody trusts anyone else's numbers.
That's not a technology problem. It's a data architecture problem. And it's fixable.
Why Excel Breaks at Scale (and When to Recognise the Signs)
Excel isn't failing you because it's a bad tool. It's failing you because it was designed for analysis, not for multi-user, real-time data management. The symptoms are predictable:
Version chaos. "Q3_report_final_v3_Priya_edits_FINAL.xlsx" — if this sounds familiar, you're already past the point where Excel works for your M&E.
No single source of truth. Field teams enter data into their spreadsheets. The M&E officer enters different data into the MIS sheet. The finance team has a third version. When the donor asks a question, three people give three different answers.
Delayed visibility. In a spreadsheet-based system, data flows from field → field coordinator → state office → head office. By the time leadership sees the data, it's 2–3 weeks old. You are managing the programme on lagging indicators, not leading ones.
No audit trail. When a number changes in a spreadsheet, there's no record of who changed it, when, or why. For CSR donors who need governance-grade reporting, this is a dealbreaker.
What "Real-Time Monitoring" Actually Means for an NGO
It doesn't mean you need a Silicon Valley-grade tech stack. It means four things:
Data entry happens at the source. Field staff enter data on their phones or tablets at the point of service — during a health camp, at a training session, during a household visit. No intermediate handoffs, no re-entry.
Everyone sees the same data. The field coordinator in Nandurbar and the programme head in Pune look at the same dashboard. There is no "your version" and "my version."
Dashboards update automatically. When a field worker submits a survey, the dashboard updates. You don't wait for someone to compile an Excel and email it.
Data is traceable. Every entry has a timestamp, a user, and a GPS coordinate (where relevant). You can audit any number back to its source.
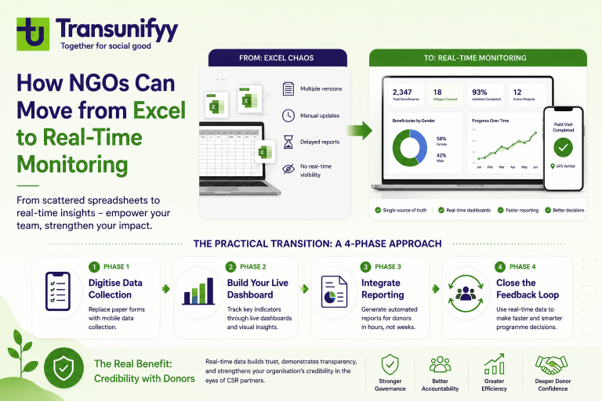
The Practical Transition: A 4-Phase Approach
Most NGOs fail at digital transitions not because the technology is wrong but because they try to change everything at once. Here's a phased approach that works:
Phase 1: Digitise Data Collection (Week 1–4) Replace paper forms with a mobile data collection tool. Keep your existing indicators and questions — just change the medium. Train field staff on the tool using their actual questionnaires. The behavioural shift is from "fill form, hand to coordinator" to "fill form on phone, data goes to cloud."
Phase 2: Build Your Live Dashboard (Week 4–8) Connect your data collection tool to a dashboard that programme managers can view. Start with 5–7 key indicators, not 50. Fewer metrics, watched frequently, are more useful than comprehensive dashboards nobody checks.
Phase 3: Integrate Reporting (Month 2–4) Configure automated reports that pull from the same data feeding your dashboard. When the donor asks for a quarterly report, it should take hours to generate — not weeks. The data is already there; you are just formatting it.
Phase 4: Close the Feedback Loop (Month 4–6) Use the real-time data to make programme decisions. If attendance at a training programme drops in a specific village, you see it within days — not at the end of the quarter. This is where digital monitoring becomes genuinely transformative.
Common Pitfalls to Avoid
Don't over-engineer: The most common failure is building a system with 200 fields when you actually need 30. Start lean. You can always add complexity later; removing it is much harder.
Don't skip training: The system is only as good as the data entered. If field staff don't understand why they are entering data (not just how), data quality will be poor regardless of the platform.
Don't abandon Excel entirely: Excel remains excellent for ad-hoc analysis, custom calculations and one-off reports. The goal isn't to eliminate Excel — it is to stop using it as your primary database.
Don't forget data ownership: Ensure your data is exportable and that you own it. If you leave a platform, your 3 years of beneficiary data should leave with you.
The Real Benefit: Credibility with Donors
The ultimate payoff of real-time monitoring isn't operational efficiency (though that helps). It's credibility.
When a CSR donor asks "how many beneficiaries have you reached this quarter?" and you can pull up a live dashboard showing 2,347 households across 18 villages with gender-disaggregated data and GPS-verified field visits, that's a fundamentally different conversation than saying "we will check and get back to you."
It signals that your organisation takes data seriously. And in an increasingly competitive CSR funding environment, that signal matters as much as the programme itself.
The move from Excel to real-time monitoring isn't a technology upgrade. It's a credibility upgrade. And for NGOs competing for CSR partnerships, credibility is currency.
Looking to strengthen your programme monitoring or impact measurement systems? Transunifyy works with NGOs, CSR teams and foundations across India to design evaluation frameworks, conduct impact assessments, build digital monitoring systems and generate evidence for stronger social impact.
Connect with us to explore how we can support your organisation.